About Me
Hi! I'm Joel Parr, a Data Scientist and Economist with a passion for leveraging data to drive impactful decision-making and streamline business processes. 📈📊I specialize in machine learning-based analysis and dynamic visualizations, helping organizations transform complex datasets into actionable insights. My work is focused on enhancing efficiency, improving data communication, and supporting data-driven strategies that solve real-world problems.With a strong foundation in financial accounting, applied finance, and economics, I develop comprehensive reports and tools that not only save time but also provide a deeper understanding of trends and patterns. My expertise in data handling and big data technologies ensures that businesses can fully utilize their data assets to gain a competitive edge.I'm dedicated to delivering solutions that make data more accessible and meaningful, empowering companies to navigate challenges and achieve their objectives in an increasingly data-centric world.
Skills
Excel | Power BI | Google Cloud | R | Python | SQL
Business Analytics - 9+ years
Data Visualisation - 4+ years
Machine Learning - 4+ years
Financial Reporting - 9+ years
Cloud Technologies - 3+ years
Big Data Technologies - 3+ years
Featured Projects
Machine Learning | XGboost | knn | Neural networksoperating income imputation for norwegian retail/wholesale trade statistics
Developed a sophisticated machine learning solution to address the issue of low-quality responses in financial data surveys for the Norwegian retail and wholesale trade sectors. Traditionally, these poor-quality responses required extensive manual correction by a team of statisticians, often taking months and involving re-contacting respondents. My solution significantly reduced the time required to rectify these issues, achieving accurate imputations in just 600.38 seconds.
SQL | Cloud Technologies
Company financial Data collection from National Tax office
Developed a SQL-based solution to transform complex, nested financial data from the Norwegian Tax Office into a flattened, query-optimized format. Leveraged cloud technologies for efficient storage and rapid querying, enhancing the accessibility, usability, and analysis of financial statistics for SSB.
Big Data | PySpark
Weather analysis coursework
This project demonstrates a comprehensive analysis of weather data using Big Data and PySpark techniques. The coursework focuses on retrieving, processing, and visualizing large-scale weather datasets to uncover significant patterns and trends. Principal Component Analysis (PCA) was used to identify dominant weather patterns.
Professional Certification
My growing list of exam-based certifications:

UC SanDiego - DSE230x:
Big Data Analytics Using Spark

UC SanDiego - DSE220x:
Machine Learning Fundamentals

UC SanDiego - DSE200x:
Python for Data Science
Python | Data Visualisation
Norwegian Industry Statistics
Project Overview:
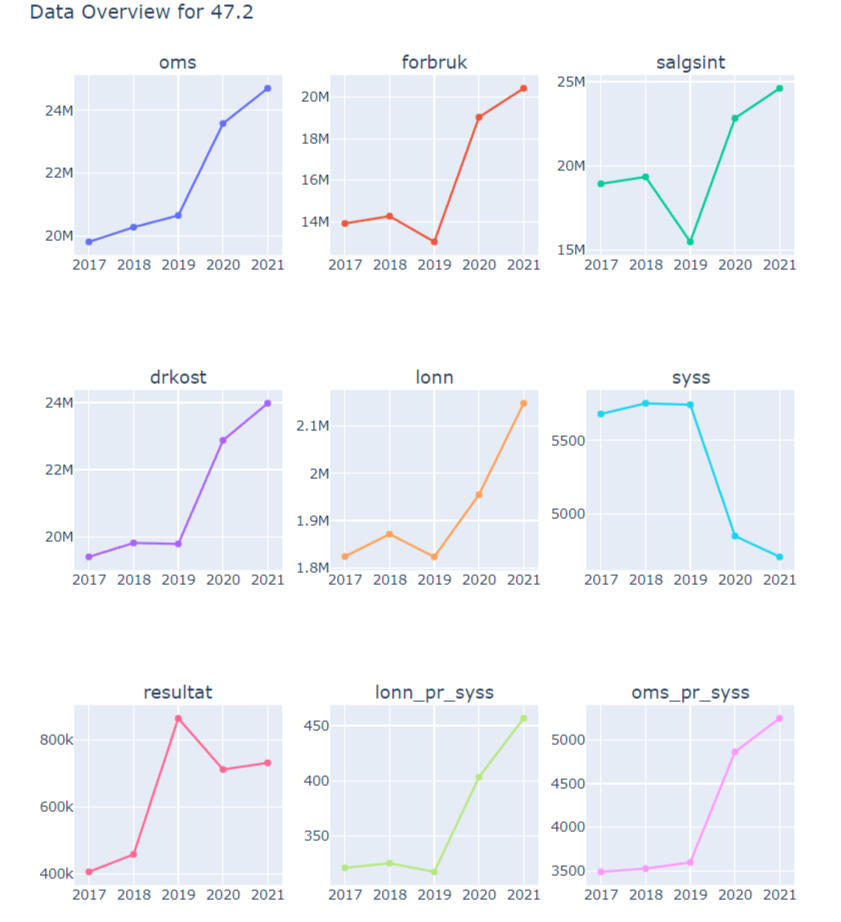
This project focused on improving the presentation of statistical data by moving beyond simple tables and creating dynamic visualizations. The main goal was to enhance how our articles convey information, particularly through time series and geographical plots.Problem Statement:
Our team relied heavily on static tables to present statistical data, which limited the ability to convey trends and regional variations effectively. This not only made data interpretation challenging but also required significant manual effort to produce.Solution:
To address this, I utilized various statistical methods to clean, organize, and process the data. Machine learning techniques were employed to generate specific variables, and I used Plotly to create interactive visualizations that display data over time and across different regions. This automation significantly reduced the workload, transforming a task that typically took a team a year into one that now only takes 600.38 seconds.Results:
The visualizations have made it easier for the team to analyze and write articles, freeing up time for deeper analysis. The dynamic visualizations allow for more effective communication of data trends and regional differences.Key Insights:The data spans multiple industries, revealing numerous insights.
During COVID-19, while many industries experienced a decline in employment, income levels rose, especially near Sweden.
This trend suggests that border closures may have benefited certain retail sectors.
For more details and to view the visualizations, please visit my GitHub repository.
Machine Learning | XGboost | knn | Neural networksoperating income imputation for norwegian retail/wholesale trade statistics
Project Overview:
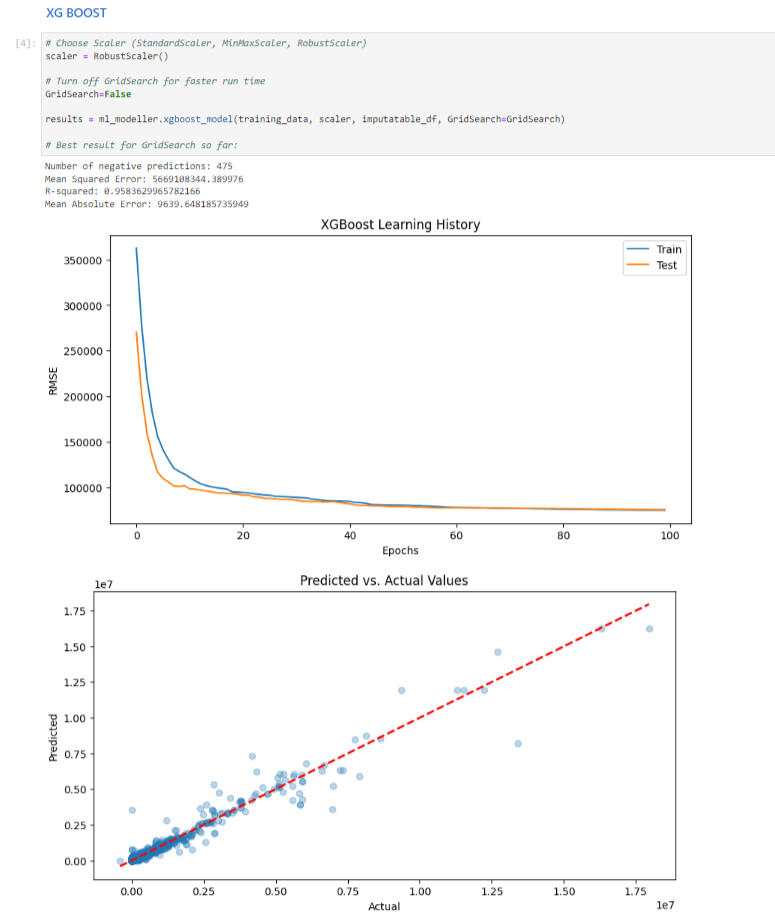
This project showcases my work using machine learning techniques such as feature engineering, hyper-parameter tuning, learning-curve visualisation, regularisation etc.Problem Statement:
This project tackled the challenge of low response rates and poor-quality financial data from thousands of businesses in our surveys. These issues previously demanded extensive resources to address, leading to suboptimal outputs.Solution:
I incorporated advanced machine learning techniques, including feature engineering, regularization, scaling, and grid search, which are detailed in my GitHub repository. The result was the development of highly accurate models with minimal errors. This automation saved thousands of hours and significantly improved the quality of the statistics produced.Results:- Applied advanced machine learning techniques to enhance data quality.
- Developed models with low error rates.
- Saved thousands of hours previously spent on data rectification.
- Produced higher quality statistical outputs.For a comprehensive overview and access to the models/code, please visit my GitHub repository.
SQL | Cloud Technologies
Company financial Data collection from National Tax office
Project Overview:
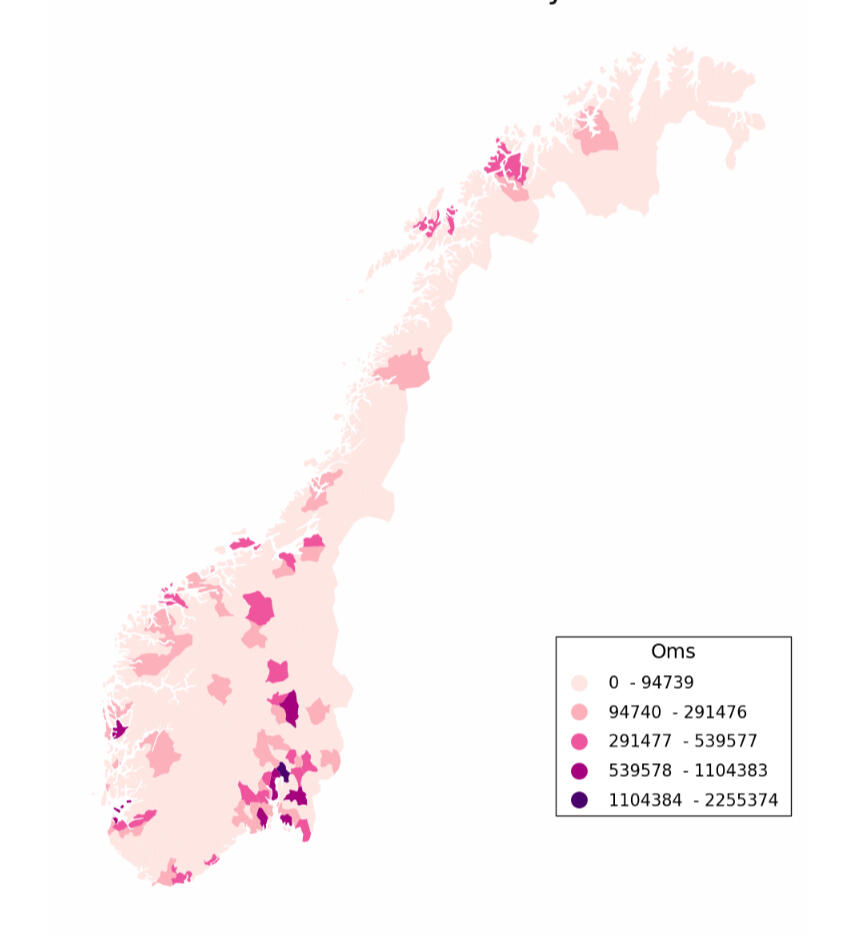
This project showcases my work on transforming high-dimensional, nested financial data from Skatteetaten (The Norwegian Tax Authority) to SSB (Statistics Norway) into a flattened, query-optimized format using SQL.Problem Statement:
Annually, Skatteetaten delivers complex, nested financial data to SSB, making direct analysis challenging. The task was to flatten, clean, and store this data efficiently for easy querying.Solution:
Using SQL, I flattened the nested data and stored it as Parquet files, optimizing for quick queries. This process involved:- Flattening the Data: Denormalizing and flattening the nested financial data.- Filtering and Cleaning: Ensuring data accuracy and consistency.- Optimized Storage: Storing data in both large main files and smaller subsets, linked by a unique identifier to enhance query performance.- Cloud Deployment: Expertly managing the secure storage and accessibility of the transformed data in Google Cloud, ensuring robust data handling and rapid querying capabilities.Results:
The transformed data is now efficiently queryable, supporting rapid analysis and visualisation (such as seen above). Performance testing showed the wide format was optimal for downstream data editing software.For detailed methods and access to the code, visit my GitHub repository.
Dashboards
Visualisations for retail/wholesale trade statistics and statistics production performance
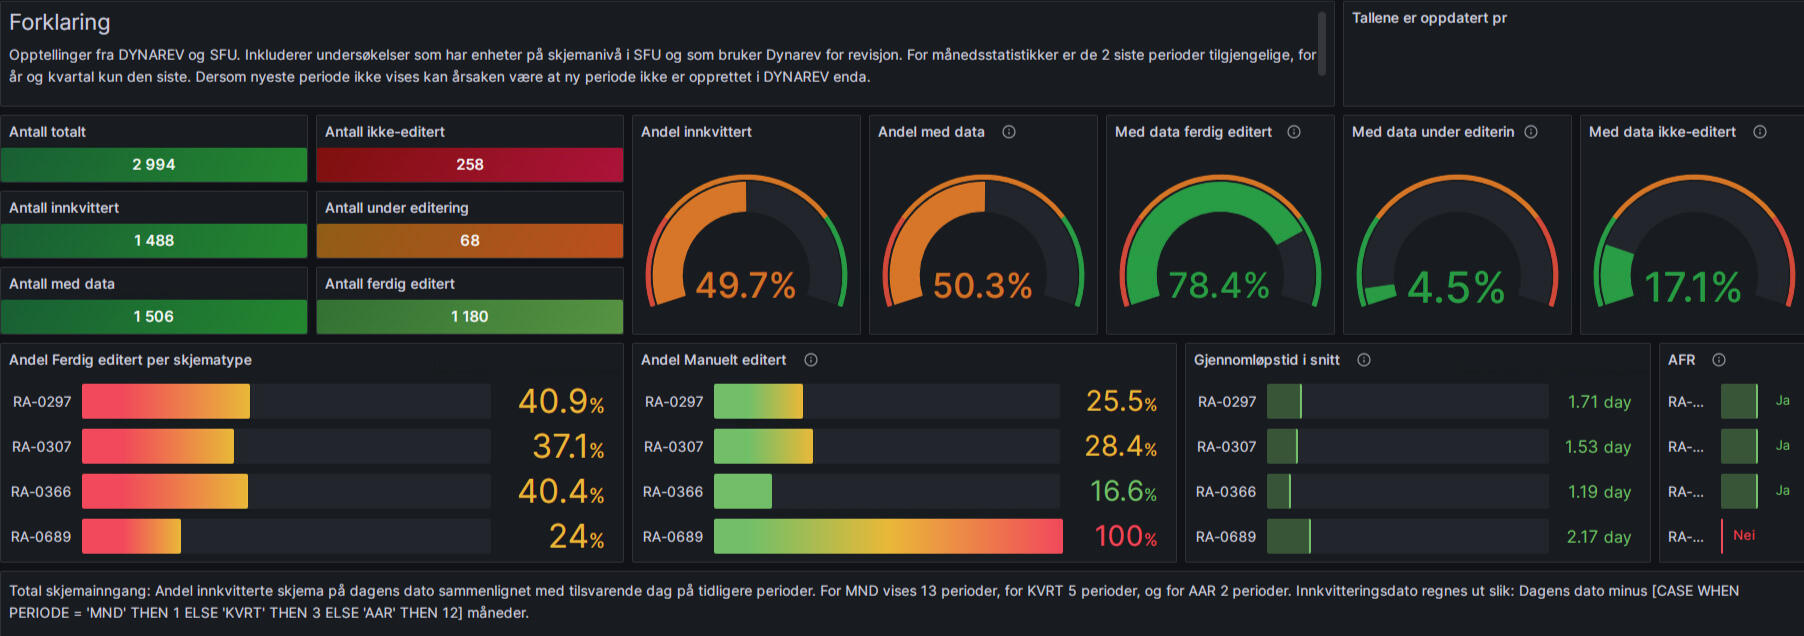
Project Overview:
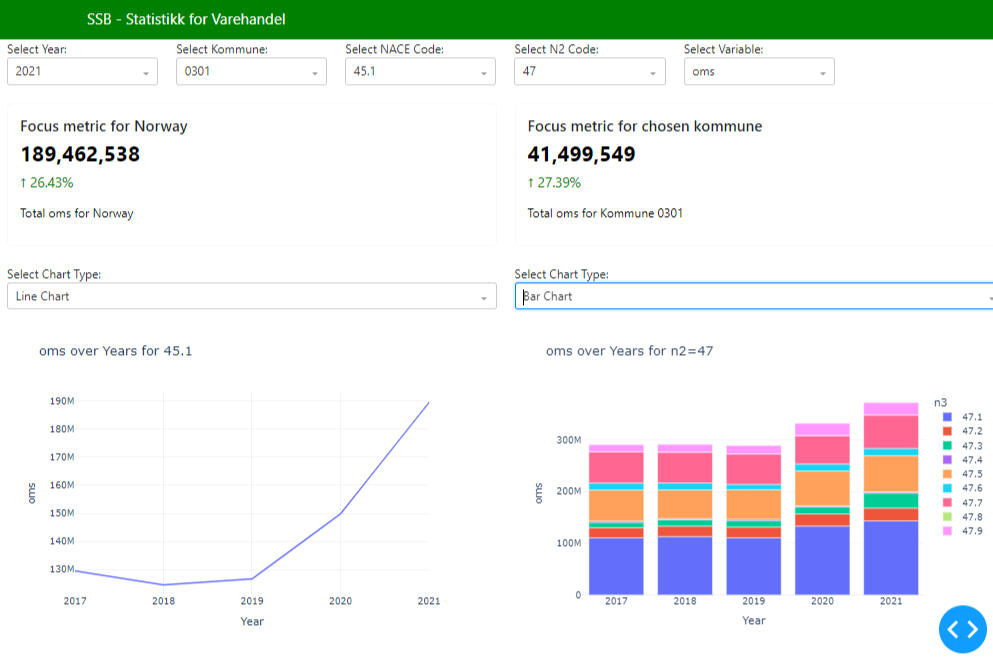
This project focused on creating dashboards to improve communication and data analysis for non-technical colleagues and management at SSB.Problem Statement:
Many colleagues at SSB are not coders or data scientists, yet they are responsible for writing articles and understanding statistical processes. Management also needs clear insights into project progress and target achievement.Solution:
I developed two dashboards:Automated Progress Dashboard (Grafana): This dashboard updates automatically, showing our current status in the statistical production process. It enables efficient communication of progress to management.Statistics Review Dashboard(Python Dash): This dashboard updates and presents publishable statistics as we progress, allowing for trend analysis and problem identification. It provides a user-friendly interface for non-coders to analyze and discuss the data, improving the process of answering public queries and publishing articles.Results:
These dashboards have streamlined communication within the team and with management, making it easier to track progress and analyze data without requiring coding expertise.For more details and access to the dashboards, visit my GitHub repository.
Big Data | PySpark
Weather analysis coursework
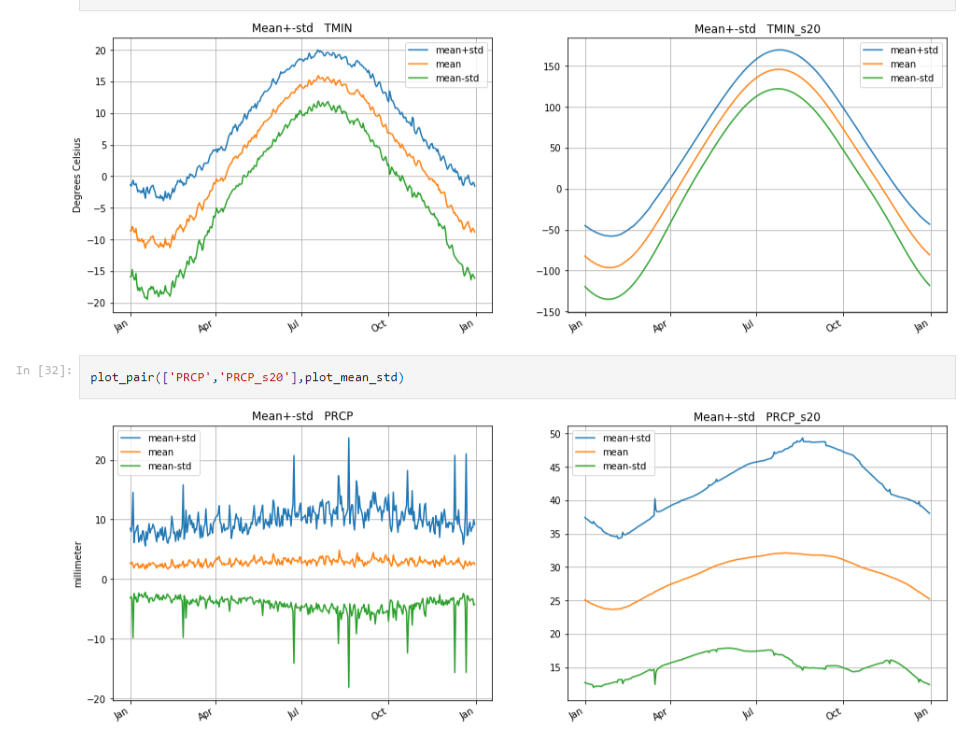
Project Overview:
This project highlights my ability to analyze large-scale datasets using Big Data technologies, specifically PySpark. It underscores the practical skills I've developed in handling and processing vast amounts of data.Problem Statement:
The challenge was to efficiently process and analyze large, complex weather datasets to uncover long-term patterns and trends. This required leveraging Big Data tools to handle the volume and complexity of the data.Solution:
In this project, I utilized PySpark to:- Data Integration and Preparation: Efficiently retrieve and merge weather data with geographical information.- Data Smoothing and Trend Analysis: Apply Gaussian smoothing techniques to uncover long-term weather patterns.- Statistical Analysis: Perform detailed computations, including mean, standard deviation, and Principal Component Analysis (PCA), to understand data variability and key components.- Visualization: Use advanced plotting techniques to visualize trends, statistical measures, and eigenvectors, making complex data more accessible and actionable.- Big Data Techniques:I leveraged PySpark's distributed computing capabilities to process and analyze the data efficiently, demonstrating a strong command of Big Data techniques that are crucial in handling the extensive datasets..Results:
This project provided valuable insights into weather patterns and demonstrated the power of Big Data tools in managing and analyzing large datasets. While the datasets in this project differ from those I normally work with (Business, Financial and Economic Data), the skills and techniques I developed are directly applicable to other domains, especially in managing and analyzing big data for statistical production.For more details and access to the code, visit my GitHub repository.


